Visualizing your data with the Chart Widget

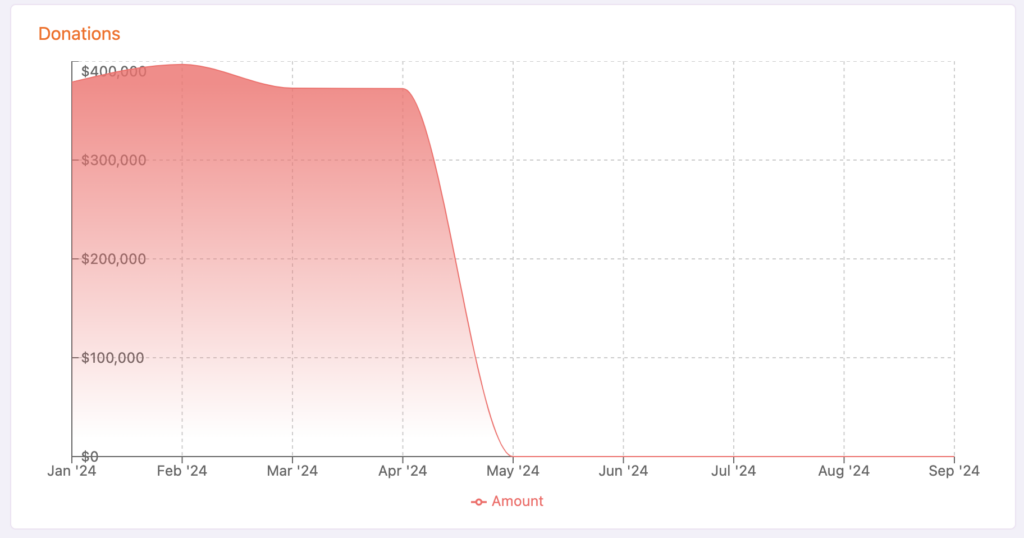
The Chart widget in Engine Awesome is a flexible and visually engaging tool that lets you represent time-based data trends in your applications.
You can configure the chart to display either the sum of specific fields or the count of records. The widget is highly customizable, allowing users to visualize critical data like donations, sales, or any other numerical metric over time. The smooth visual presentation helps make complex datasets more digestible, whether for monitoring trends, forecasting, or reporting performance metrics.

The Show Count option is particularly useful for cases where you want to track the number of occurrences rather than the sum of values, making it great for monitoring how often specific actions are happening, such as new client signups or tasks completed.
Additionally, since layouts in Engine Awesome are highly customizable, you can easily embed the Line Chart in dashboards or detailed record views, tailoring it to your exact data analysis needs.